Every year, millions of Americans face the same question: Should I keep renting, or is it finally time to buy?
In 2026, that question is harder than ever. Mortgage rates have cooled from their 2023 peak but remain well above the sub-3% era. Home prices are still elevated in most markets. Yet rents are rising too — in many cities, monthly rent has surpassed what a mortgage payment would be on the same property.
So which is actually cheaper? The honest answer: it depends — and the math is different for every household.
This guide breaks down every cost on both sides of the equation, explains the hidden factors most calculators ignore, and walks you through exactly how to use RealCostIQ’s Rent vs. Buy Calculator to get a personalized answer in under two minutes.
For most buyers in high-cost metros, the break-even point in 2026 is 5–8 years. If you plan to stay shorter than that, renting almost always wins financially. If you’re staying longer, buying typically builds more wealth — but the gap is smaller than it used to be.
1. The Real Costs of Renting
Most people think of renting as simple: monthly rent + renter’s insurance. Done. But the true cost of renting is a bit more complex.
Monthly Rent
The obvious one. According to Zillow’s February 2026 data, the national median rent for a 2-bedroom apartment is $1,842/month. In major metros:
| City | Median 2BR Rent (2026) |
| San Francisco | $3,200 |
| New York City | $3,650 |
| Austin, TX | $1,780 |
| Phoenix, AZ | $1,590 |
| Charlotte, NC | $1,520 |
| Columbus, OH | $1,210 |
*Sources: Zillow Rent Index, February 2026*
Renter’s Insurance
Often forgotten in rent vs. buy comparisons. Average cost: $15–$30/month ($180–$360/year). Cheap, but real.
Annual Rent Increases
This is the killer long-term factor. Over the past 10 years, rents have risen an average of 3.2% per year nationally. At that rate, a $1,800/month apartment in 2026 becomes $2,460/month by 2036. Over 10 years, you’ll pay roughly $241,000 in rent — with zero equity to show for it.
The Opportunity Cost of Not Building Equity
When you rent, you’re not building equity — but your landlord is. Every month, a portion of their mortgage is paid down by your rent check. Over 10 years in a $400,000 home, a buyer builds roughly $70,000–$90,000 in equity through principal paydown alone (before appreciation).
2. The Real Costs of Buying
Buying looks deceptively simple on the surface — down payment + monthly mortgage. But the true cost of homeownership includes several line items renters never pay.
Down Payment
The most significant upfront cost. Conventional wisdom says 20%, but:
- Conventional loan: 3–20% down
- FHA loan: 3.5% down (with a credit score of 580+)
- VA loan: 0% down (for eligible veterans)
- First-time buyer programs: Many states offer 0–3% down assistance
On a $400,000 home at 20% down, that’s $80,000 upfront — plus closing costs.
Monthly Mortgage Payment
At the average 30-year fixed rate of 6.8% (March 2026), a $320,000 loan (after 20% down on a $400K home) costs:
$2,089/month — principal + interest only
Property Taxes
Varies wildly by state. National average: 1.07% of home value per year.
On a $400,000 home: ~$4,280/year = $357/month
| State | Effective Property Tax Rate |
| New Jersey | 2.23% |
| Illinois | 1.97% |
| Texas | 1.60% |
| California | 0.73% |
| Hawaii | 0.28% |
Homeowner’s Insurance
Average: $1,428/year nationally = $119/month
(Source: Insurance Information Institute, 2026)
HOA Fees (Where Applicable)
If buying a condo or in a planned community, the average is $250–$400/month in most metros.
Private Mortgage Insurance (PMI)
If your down payment is less than 20%, you’ll pay PMI:
- Typical cost: 0.5%–1.5% of the loan per year
- On a $320,000 loan: $133–$400/month extra
- PMI drops off once you reach 20% equity
Maintenance and Repairs
This is the most underestimated cost of homeownership.
The standard rule of thumb: budget 1%–2% of home value per year for maintenance.
On a $400,000 home: $4,000–$8,000/year ($333–$667/month)
Older homes, harsh climates, and deferred maintenance can push this higher. Our Home Maintenance Calculator can give you a property-specific estimate.
3. The Hidden Costs Nobody Talks About
Closing Costs (Buying)
Closing costs typically run 2%–5% of the purchase price.
On a $400,000 home: $8,000–$20,000 paid at closing, on top of the down payment.
Line items include:
- Loan origination fee
- Appraisal fee (~$500)
- Title insurance (~$1,000–$1,500)
- Prepaid property taxes and insurance (escrow setup)
- Recording fees, transfer taxes (vary by state)
Closing Costs (Selling)
When you eventually sell, you’ll pay 5%–6% in agent commissions plus additional closing costs. On a $400,000 home, selling costs eat $20,000–$24,000 of your equity.
This is why short time horizons hurt buyers so badly. If you buy and sell within 2–3 years, those transaction costs can wipe out all appreciation gains.
Lost Investment Returns on Your Down Payment
Your $80,000 down payment is no longer investable. If that money instead went into an S&P 500 index fund returning 7% annually, it would grow to roughly $157,000 after 10 years.
This “opportunity cost” is real money — and most rent vs. buy calculators ignore it entirely. RealCostIQ’s calculator includes it.
Tax Deductions (Buying)
Homeowners can deduct:
- Mortgage interest (on loans up to $750,000)
- Property taxes (up to $10,000 SALT cap)
In practice, after the 2017 Tax Cuts and Jobs Act raised the standard deduction, only ~13% of taxpayers itemize. If you don’t itemize, these deductions are worth nothing to you.
4. How the Break-Even Analysis Works
The break-even point is the number of years you need to stay in a home before buying becomes financially superior to renting.
Simple Formula
Break-Even = (Total Cost to Buy − Total Cost to Rent) ÷ Annual Equity Built
But a true break-even analysis factors in:
- Principal paydown curve (accelerates over time)
- Home price appreciation (historically 3–4%/year nationally)
- Rent inflation (historically 3–3.5%/year)
- Investment returns on the down payment alternative
- Tax benefits (if applicable)
- Selling costs at exit
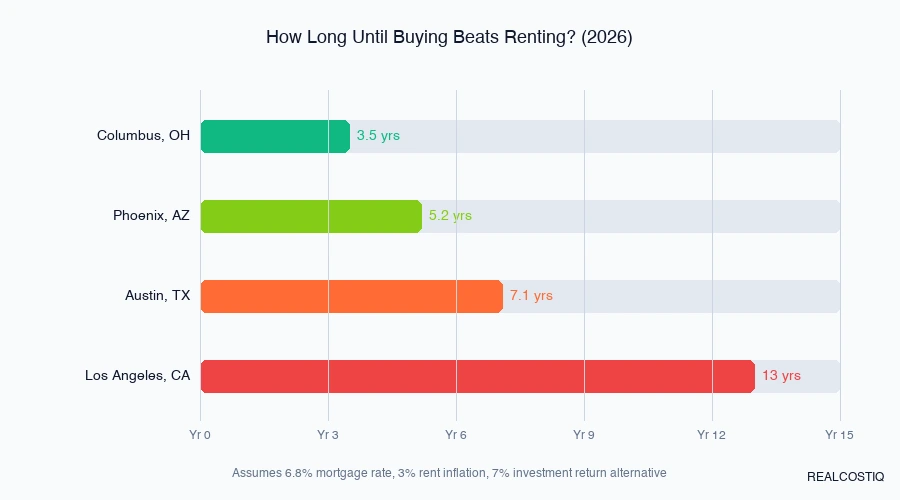
2026 Break-Even Estimates by Scenario
| Scenario | Monthly Rent | Home Price | Down | Break-Even |
| Mid-size city (Columbus, OH) | $1,210 | $280,000 | 10% | 3.5 years |
| Sun Belt growth market (Phoenix) | $1,590 | $380,000 | 10% | 5.2 years |
| High-cost metro (Austin) | $1,780 | $475,000 | 20% | 7.1 years |
| Major city (Los Angeles) | $2,800 | $850,000 | 20% | 12+ years |
*Assumes 6.8% mortgage rate, 3% rent inflation, 3.5% home appreciation, 7% investment return alternative.*
5. 2026 Market Snapshot: Where Does Buying Actually Win?
Markets Where Buying Wins (Short Break-Even)
These markets have low home prices relative to rents, creating favorable buy conditions:
- Detroit, MI — Buy-to-rent ratio heavily favors buying; break-even under 3 years
- Cleveland, OH — Strong rental demand keeps rents high vs. home prices
- Pittsburgh, PA — Low prices, stable appreciation, short break-even
- Memphis, TN — Landlord-friendly market but buying is still cheaper long-term
- St. Louis, MO — Affordable entry point makes the math work quickly
Markets Where Renting Is Better (Long Break-Even)
- San Francisco, CA — Astronomical prices, break-even 15+ years
- Honolulu, HI — Similar story; prices detached from incomes
- New York City, NY — Co-op fees and prices push break-even past 10 years
- Los Angeles, CA — Unless you bought before 2015, renting is often rational
The Hybrid Answer: Rent Now, Buy Later
If rates drop to 5.5% or below (a scenario some forecasters project for late 2026–2027), the math shifts meaningfully. A $320,000 loan at 5.5% instead of 6.8% saves $285/month — nearly $3,400/year. That alone cuts the break-even by 1–2 years in most markets.
6. Rent vs. Buy by Life Stage
Early 20s: Almost Always Rent
- Job changes are frequent — you need mobility
- Credit score is still building (lower = worse mortgage rate)
- Down payment is typically not yet saved
- Exception: If you’re in a very affordable market and plan to stay 5+ years, an FHA loan at 3.5% down can make sense
Late 20s – Mid 30s: The Sweet Spot
- Career stability increasing
- Likely to stay in one place 5–10 years
- Can realistically save a down payment
- This is when buying typically makes the most financial sense
Mid 30s – 40s: Family Formation
- School district quality matters → drives you toward specific neighborhoods
- Larger home needed → higher price point
- Time horizon long (kids in school for 10–18 years)
- Buying strongly preferred if you can qualify
50s and Beyond: Depends on Lifestyle
- Buying close to retirement has a shorter horizon to recoup costs
- Downsizing or moving to a retirement market may mean renting first
- Reverse mortgage possibilities if already own
7. How to Use the RealCostIQ Rent vs. Buy Calculator
Our Rent vs. Buy Calculator does all of the above math for your specific situation in under 2 minutes.
Step 1: Enter Your Rental Details
Input your current monthly rent (or the rent for the place you’re considering). The calculator will project your total rent cost over your time horizon, including rent inflation.
Step 2: Enter Home Purchase Details
- Home price
- Down payment percentage
- Loan type (30-year fixed, 15-year fixed, ARM)
- Current interest rate (defaults to current average, which you can adjust)
Step 3: Enter Local Cost Assumptions
- Property tax rate (we pre-fill with your state’s average)
- HOA fees (if applicable)
- Annual maintenance budget
Step 4: Set Your Time Horizon
This is the most important input. How many years do you plan to stay?
Step 5: Review Your Results
The calculator outputs:
- Total cost to rent over your time horizon
- Total cost to own over your time horizon (including equity built)
- Net financial advantage of buying or renting
- Break-even year — when buying overtakes renting
You can also download your results as a shareable image or copy a link to share with a partner or financial advisor.
8. Frequently Asked Questions
Is it better to rent or buy in 2026?
For most people planning to stay in a home 5+ years, buying still builds more long-term wealth. However, in high-cost cities like San Francisco or NYC, the break-even point can exceed 10–12 years, making renting financially rational. Use the calculator above with your specific numbers to get a personalized answer.
What mortgage rate should I use in my calculation?
As of March 2026, the national average 30-year fixed mortgage rate is approximately 6.8%. Your actual rate will depend on your credit score, loan size, and lender. Get a real pre-approval quote and use that rate for the most accurate calculation.
Does renting mean I’m throwing money away?
No. This is one of the most persistent myths in personal finance. Renters gain housing services, flexibility, and the ability to invest their down payment elsewhere. The question isn’t whether renting is “wasting money” — it’s whether the total cost of owning beats the total cost of renting over your specific time horizon.
How much should I have saved before buying?
At minimum: down payment + 2–5% for closing costs + 3–6 months of mortgage payments as an emergency reserve. On a $400,000 home with 10% down, that’s roughly $55,000–$70,000 before you should seriously consider buying.
What’s the impact of a 1% difference in mortgage rate?
On a $300,000 loan, a 1% rate difference changes your monthly payment by approximately $170/month — about $2,040/year. Over a 30-year loan, that’s over $61,000 in additional interest paid.
Should I buy if I’m not sure I’ll stay more than 3 years?
Generally no. Closing costs alone (2–5% to buy + 5–6% to sell) mean you need significant appreciation just to break even on transaction costs, which typically takes 4–6 years in most markets.
The Bottom Line
The rent vs. buy decision isn’t a moral judgment — it’s math. And in 2026, the math is genuinely nuanced:
- Buy if you’re staying 5+ years, have a solid down payment, and your monthly payment (including taxes, insurance, and maintenance) is within 10–20% of comparable rent
- Rent if you’re likely to move within 3–4 years, you’re in a high-cost city, or you can generate better investment returns with your down payment
- Run the numbers with your actual figures — because the “right” answer in Columbus, Ohio, is completely different from the answer in Seattle, Washington
→ Try the RealCostIQ Rent vs. Buy Calculator Now
Related Calculators
- Mortgage Affordability Calculator — How much house can you qualify for?
- Down Payment Savings Calculator — How long to save your down payment?
- Home Maintenance Cost Calculator — What will repairs actually cost you?
*This article is for educational purposes only and does not constitute financial advice. Consult a licensed financial advisor or mortgage professional before making major financial decisions.*
*Sources: Zillow Rent Index (Feb 2026), Freddie Mac Primary Mortgage Market Survey (Mar 2026), Insurance Information Institute (2026), National Association of Realtors (2026).*