People often say that paying rent is throwing money away. People on the other side say a home loan is a trap. Both are half true. A rent payment buys you a place to live and nothing else. An EMI buys you a place to live, plus a share of a flat that may rise or fall in price. But the EMI is also much bigger than the rent, and most of an early EMI is interest, which you never see again.
This post puts numbers on that. We compare the two paths on one flat, then on three cities. We read every source named here on 15 October 2026. The sums use the same method as our rent vs buy calculator. We write the inputs under each table so you can test your own.
A worked example first: an ₹80 lakh flat in Bengaluru
Start with a round number. Rent yield is a year of rent divided by the price of the flat. Anarock Research, a private property consultancy, put Bengaluru's average rent yield at 4.6% in Q2 2026. On an ₹80 lakh flat, 4.6% is about ₹3.68 lakh of rent a year, or about ₹30,700 a month. We round it down to ₹30,000 a month.
Now the other side. Say you pay 20% down, which is ₹16 lakh. You borrow ₹64 lakh for 20 years at 8.50%, the rate HDFC Bank's page showed on 15 October 2026 for a credit score of 800 or more. The EMI, the fixed monthly payment on the loan, comes to ₹55,541. In the first month, ₹45,333 of that is interest. That is 82%. Only ₹10,208 reduces the loan.
So on day one you pay ₹55,541 to own, against ₹30,000 to rent. The owner pays ₹25,541 more every month. The owner also pays a one-time cost to register the flat. For Karnataka, our stamp duty engine gives ₹6,08,000 on an ₹80 lakh flat: ₹4,00,000 stamp duty, ₹48,000 of levies on that duty, and a ₹1,60,000 registration fee. That is 7.6% of the price, and the buyer pays it in cash.
To compare fairly, both people start with the same money. The owner puts ₹22.08 lakh into the flat (₹16 lakh down plus ₹6.08 lakh of duty and registration). The renter keeps that ₹22.08 lakh and invests it. Each month, whoever pays less invests the difference. We count net worth at the end of each year. For the owner, that is the flat's value minus the loan still owed, plus any savings. For the renter, it is the invested pot.
| Input | Value | Where it comes from |
|---|---|---|
| Flat price | ₹80,00,000 | Round number chosen for the example |
| Rent in month one | ₹30,000 | About 4.6% yield (Anarock, Q2 2026), rounded down |
| Rent rise each year | 5% | Our assumption; you can change it |
| Loan | ₹64,00,000 for 20 years at 8.50% | Rate from HDFC Bank page, 15 October 2026 |
| Down payment | ₹16,00,000 (20%) | RBI allows 80% LTV on loans of ₹30 lakh to ₹75 lakh |
| Stamp duty and registration | ₹6,08,000 | Karnataka rates in our engine, last read 24 August 2026 |
| Flat price rise each year | 3.6% | RBI All-India House Price Index, year to Q1 2026-27 |
| Return on money you save or invest | 6.5% a year | Our assumption; not a forecast, not advice |
| After | Owner's net worth | Renter's net worth | Who is ahead |
|---|---|---|---|
| 5 years | ₹39,07,340 | ₹46,14,032 | Renter, by ₹7,06,692 |
| 10 years | ₹69,14,692 | ₹72,70,186 | Renter, by ₹3,55,494 |
| 13 years | Owner passes the renter this year | Renter falls behind this year | Break-even |
| 15 years | ₹1,09,52,420 | ₹1,01,53,306 | Owner, by ₹7,99,114 |
| 20 years | ₹1,72,24,257 | ₹1,39,10,909 | Owner, by ₹33,13,348 |
Computed with the inputs above. Break-even is the first year-end when the owner's net worth is at least the renter's. Not modelled: society maintenance, property tax, repairs, brokerage when you sell, and the rent deposit a renter pays. All of these are real. Most hit the owner, so they push break-even later. See the section on running costs.
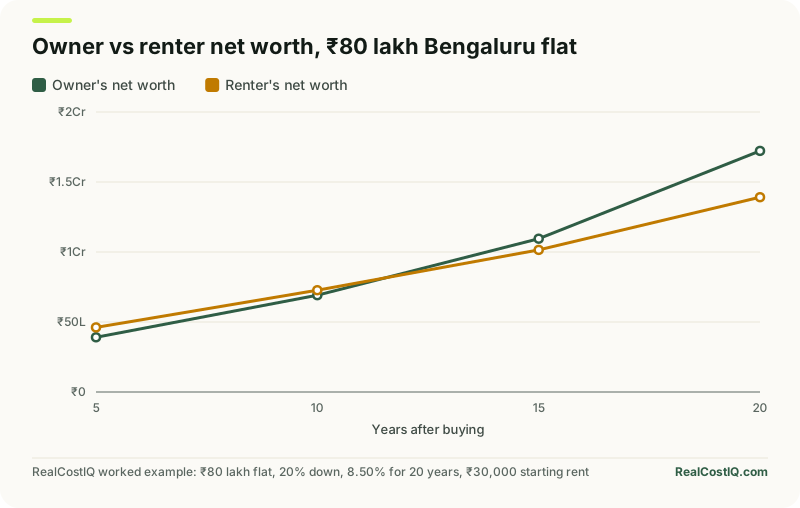
Read it in three parts. For the first 12 years the renter is ahead. In year 13 the owner catches up. After that the gap grows quickly, and by year 20 the owner is ahead by about ₹33 lakh. The reason is simple. Rent rises 5% a year while the EMI stays fixed. At 5% a year, ₹30,000 of rent reaches ₹55,541 after about 12.6 years. From then on the owner pays less each month than the renter, and the loan ends in year 20, after which the owner pays no EMI at all.
Our calculator follows the same method
If you run these same inputs through our rent vs buy calculator and choose Karnataka as the state, it gives the same answer as the table above. The renter is ahead by about ₹3.55 lakh at 10 years, and buying catches up in year 13. The calculator takes stamp duty and registration from the state you pick, the same way our stamp duty calculator does. It also lets whoever pays less each month invest the gap. The inputs are the ones under the table: price rise 3.6% a year, rent rise 5%, return 6.5%, loan rate 8.50% for 20 years. The calculator's own starting values differ, so its first answer will differ until you change them.
The core problem: rent earns 4.6%, the loan costs 8.5%
Think of the rent you do not pay as the income your flat gives you. On an ₹80 lakh flat that is about ₹3.7 lakh a year, 4.6% of the price. The loan on it charges 8.50% on the money you owe. For the owner to break even, the flat's price has to rise by enough to cover the gap. The gap is the loan rate minus the rent yield, about 3.9 percentage points here, plus the stamp duty you paid up front and the other running costs of owning.
In India the gap is wide. Property is priced for growth, not for rent. When rents are low compared to prices, buying gets harder to justify on monthly cash alone. That is the main reason many Indian buyers say they bought for the future and not for the rent saved. Our rental yield calculator lets you work out the yield on any flat you are looking at, using the rent you could get for it.
Three cities side by side
We took an 800 sq ft flat at each city's average price per square foot and rent yield from Anarock's study of 11 markets, covering 2019 to Q2 2026. The study was reported by Business Today on 4 August 2026 and by Outlook Money on the same date. We could not reach Anarock's own release. The articles do not say how Anarock defines yield or the area behind its price per square foot. So read this as one private estimate, not a measured fact.
We chose Mumbai, Bengaluru and Delhi because Anarock gives both a price and a yield for them and because we hold their state duty rules. We left out Hyderabad. Anarock gives its yield, but our stamp duty engine for Telangana does not include that state's transfer duty, so we could not price the upfront cost honestly.
| City (state) | Price per sq ft | Flat price | Rent yield | Rent a month | Loan and down payment | EMI (20 years, 8.50%) | EMI vs rent |
|---|---|---|---|---|---|---|---|
| Mumbai (Maharashtra) | ₹29,270 | ₹2,34,16,000 | 4.3% | ₹83,907 | Loan ₹1,75,62,000; down ₹58,54,000 (25%) | ₹1,52,407 | 1.8 times |
| Bengaluru (Karnataka) | ₹9,450 | ₹75,60,000 | 4.6% | ₹28,980 | Loan ₹60,48,000; down ₹15,12,000 (20%) | ₹52,486 | 1.8 times |
| Delhi (NCT) | ₹26,700 | ₹2,13,60,000 | 3.2% | ₹56,960 | Loan ₹1,60,20,000; down ₹53,40,000 (25%) | ₹1,39,025 | 2.4 times |
Prices per sq ft and yields: Anarock Research, 2019 to Q2 2026, as reported by Business Today and Outlook Money. The down payment follows the RBI loan-to-value limit: 80% for loans up to ₹75 lakh and 75% above that, so a loan above ₹75 lakh needs 25% down. Rent is price times yield, divided by 12. The 8.50% rate is the HDFC Bank rate for a credit score of 800 or more as shown on 15 October 2026. Your rate may differ.
In all three cities the EMI is 1.8 to 2.4 times the rent. Delhi is the steepest, because its yield, 3.2%, is the lowest. Now the upfront cost. Each state sets its own, and the buyer pays it in cash. The figures below are for a man buying alone. Maharashtra and Delhi charge less for a woman buying alone, and Karnataka does not, per our engine. For a woman buying alone, the engine gives ₹12,00,800 in Mumbai (stamp duty 4% instead of 5%) and ₹9,54,400 in Delhi (4% instead of 6%). A man and a woman buying jointly in Delhi pay 5%, or ₹11,68,000 in all. Bengaluru stays at ₹5,74,560 for any buyer.
| City (state) | What the state charges | Total | Share of price | Rate last read |
|---|---|---|---|---|
| Mumbai, BMC area (Maharashtra) | Stamp duty 5% (₹11,70,800), metro cess 1% (₹2,34,160), registration fee 1% capped at ₹30,000 | ₹14,34,960 | 6.1% | 24 August 2026 |
| Bengaluru, BBMP area (Karnataka) | Stamp duty 5% (₹3,78,000), cess and surcharge on the duty (₹45,360), registration fee 2% (₹1,51,200) | ₹5,74,560 | 7.6% | 24 August 2026 |
| Delhi (NCT of Delhi) | Stamp duty 6% for a man (₹12,81,600), registration fee capped at ₹1,00,000 | ₹13,81,600 | 6.5% | 21 August 2026 |
Computed with the RealCostIQ stamp duty engine. On 15 October 2026 the Maharashtra, Karnataka and Delhi registration portals refused our connection, so we could not re-read them. The dates in the last column are the dates the engine last read each rate at the state source. The Karnataka registration fee of 2% rests on a 29 August 2025 department notification in our engine. A cached search listing of the department's fee page still showed 1%. Confirm the rate with your sub-registrar before you rely on it. Rates also differ for resales, other city bodies and the buyer's gender.
Bengaluru's duty looks small in rupees because the flat is cheaper, yet it is the highest share of price at 7.6%. Mumbai's registration fee is capped at ₹30,000, so the registration part is tiny. Delhi's is capped at ₹1 lakh. Our true cost of buying a flat post covers these one-time costs, plus GST, brokerage and loan fees, in full.
When does buying catch up? The break-even year by city
The break-even year depends most on one guess: how fast the flat's price rises. We ran three cases for each city. The first uses the RBI's All-India House Price Index, which rose 3.6% in the year to Q1 2026-27. The RBI release says the index stood at 117.5, covers 18 cities, uses 2022-23 as the base year, and rose 1.1% in the quarter. It gives no city figures on the page, so 3.6% is a national number, not a city one. The second case is 6% a year. The third uses each city's own price growth since 2019 from Anarock, which we turned into a yearly rate by assuming about seven years. That gives roughly 7.3% for Mumbai, 9.6% for Bengaluru and 5.7% for Delhi. Those are past figures, from a private source, and not a forecast.
| City | Price rises 3.6% a year (RBI all-India) | Price rises 6% a year | Price rises at the city's 2019 to 2026 pace |
|---|---|---|---|
| Mumbai | Year 12 | Year 3 | Year 2 (at 7.3%) |
| Bengaluru | Year 12 | Year 4 | Year 2 (at 9.6%) |
| Delhi | Not within 30 years | Year 6 | Year 7 (at 5.7%) |
Computed for the flats in the table above, with rent rising 5% a year, a 20-year loan at 8.50%, and 6.5% a year on any money the renter or owner saves. A smaller price rise than the figures shown pushes the year later. These flats are cheaper or dearer than the ₹80 lakh example, which is why Bengaluru reads year 12 here and year 13 there. Hyderabad is not shown for the reason given above.
The table tells two stories. If prices rise only as fast as the all-India index, buying takes 12 years to catch up in Mumbai and Bengaluru and never does in 30 years in Delhi. If prices rise as they did in Mumbai and Bengaluru since 2019, buying wins within two years. The first story is what happens to a flat bought at an average price in an average market. The second is what happened to buyers in two fast-growing cities. Nobody knows which one you will get. That is why the break-even year is a range, and why saying a flat is always a good buy, or always a bad one, is wrong.
What moves the answer: four dials
Go back to the ₹80 lakh Bengaluru flat. Change one input at a time and see how the break-even year moves from year 13.
| Input changed | Value | Break-even year |
|---|---|---|
| Flat price rise a year | 0% | Year 30 (barely) |
| Flat price rise a year | 3.6% (base case) | Year 13 |
| Flat price rise a year | 6% | Year 4 |
| Flat price rise a year | 8% | Year 2 |
| Rent rise a year | 3% | Year 21 |
| Rent rise a year | 5% (base case) | Year 13 |
| Rent rise a year | 7% | Year 10 |
| Loan rate (EMI) | 7.50% (₹51,558) | Year 8 |
| Loan rate (EMI) | 8.50% (₹55,541, base case) | Year 13 |
| Loan rate (EMI) | 9.50% (₹59,656) | Year 18 |
| Return on money saved | 4% | Year 7 |
| Return on money saved | 6.5% (base case) | Year 13 |
| Return on money saved | 9% | Not within 30 years |
| Extra owner costs of ₹60,000 a year, rising 5% | Added | Year 21 |
Same inputs as the worked example, changing one at a time. The ₹60,000 a year is an illustration of maintenance and property tax, not a measured figure for any society or city. Your own costs may be lower or higher. Check them and test them.
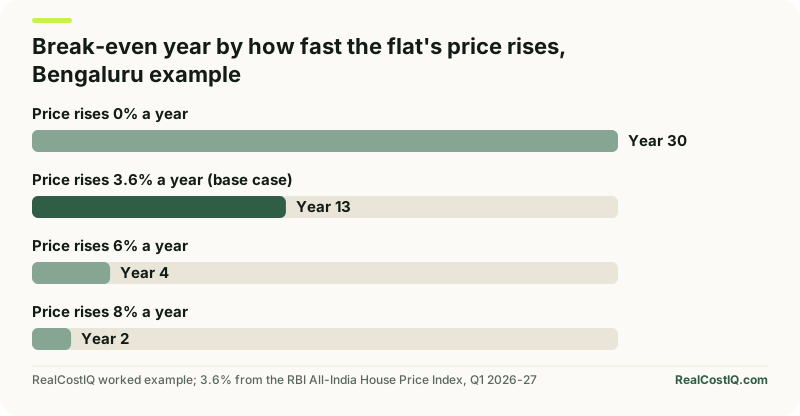
Look at which dials matter. The flat's price growth matters most. A swing from 3.6% to 6% moves break-even from year 13 to year 4. The rate on your loan matters a lot too. One percentage point cuts or adds five years. If the RBI lifts the repo rate again, floating loans follow, and the break-even year moves out. Our home loan EMI calculator shows what a change in rate does to your own payment.
The return on saved money works in the other direction. The more the renter earns on the pot, the better renting looks. At 9% a year, buying never catches up in 30 years here. At 4% it does in year 7. We do not know what return any reader will earn, and we do not suggest where to put money. Use the figure that matches your own habits, and be honest about whether you will save the difference at all. A renter who spends the ₹25,000 a month saved does not get this result.
Running costs push the date out
The table above leaves out costs that only an owner pays. Society maintenance is a monthly bill in most apartment complexes. Property tax is a yearly bill to the local body. Repairs and painting come every few years. When you sell, a broker may take a commission and you may need to pay for paperwork. Add ₹60,000 a year for these and the Bengaluru break-even moves from year 13 to year 21.
A renter pays a security deposit to the landlord, which is returned at the end but earns nothing meanwhile. A renter also faces the risk of a rent rise or an eviction notice. These are real, but they are smaller than an owner's costs in most cases. Do not leave them out of your own sums.
How to use this for your own decision
This post cannot tell you what to do. It can tell you what to check. Here is a short list.
- Find the rent yield of the exact flat. Ask what a similar flat in the same building rents for, and divide a year of that by the price. The lower it is compared with your loan rate, the more buying leans on price growth.
- Compare the EMI to the rent. If the EMI is 1.8 times the rent or more, you are choosing to put a lot of cash into the flat in the early years.
- Add the one-time costs. Stamp duty and registration depend on your state, city and gender. A bank does not finance them for a home above ₹10 lakh, per the RBI Directions.
- Pick a stay length. At the all-India price rise of 3.6%, the owner is behind until about year 12 in Mumbai and Bengaluru. If you expect to move sooner than that, buying needs faster price growth to work. If you expect to stay 15 years or more, the owner is ahead at that rate in the Bengaluru example.
- Test price growth at 3%, 5% and 7%. If buying only works at 7%, you are betting on a boom.
- Be honest about saving. The renter's result needs the monthly saving to happen.
What this comparison cannot tell you
The Anarock numbers are private estimates, reported by news sites. The method behind them is not public in the articles we read. The RBI index is national and measures something different. The two should not be read as one data set. One uses a long run since 2019, and the other covers a single year. We have chosen three cities, and others can look very different. The flat in the example is an average flat, and real flats vary a lot with locality, floor, builder and age. If you plan to let the flat out and not live in it, our post on rental yield against home loan cost works the monthly gap from the landlord's side.
We also leave out three things on purpose. We do not cover tax relief on home loans or rent, because tax is outside this site's scope. We do not cover government subsidies, because their rules change and we did not confirm any today. And we do not cover feelings. Many people buy a home for safety and for a sense of settling down, and many people rent to keep options open. Neither is wrong. They are costs and benefits that no table can price.