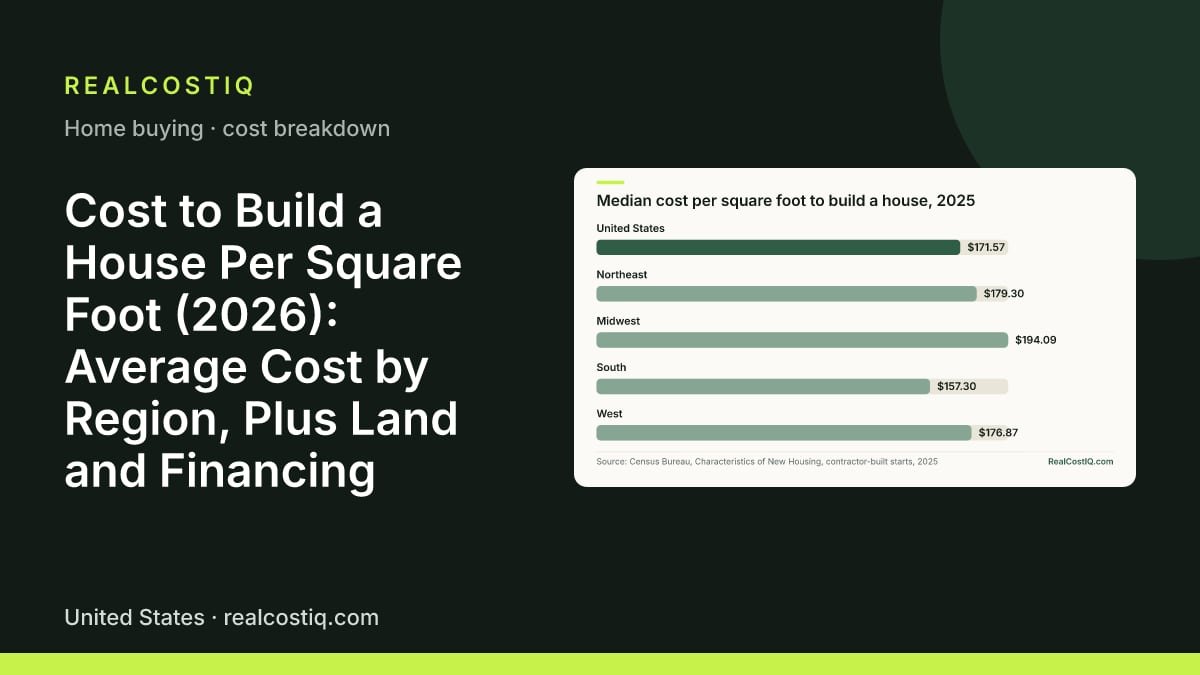
Search for what a new house costs and you get a per-square-foot number with no explanation of what is being divided. Two primary datasets exist for the United States, and they divide different things. The National Association of Home Builders (NAHB) asks builders to split the sale price of a typical new house into seven parts. The Census Bureau's Survey of Construction records something else. It records the contract price awarded to a general contractor for new houses, with land excluded. This post puts the two side by side and shows the arithmetic. It also lists what a per-square-foot quote typically does not contain. Every dollar figure below is copied from those sources or computed from them, and the calculation is shown.
This is a cost post, not a financing post. A construction loan releases money in draws, converts to a permanent mortgage and charges interest on the drawn balance. That is covered on the construction loan calculator. This post stops at the point where you know what number to enter in its build-cost field.
Average cost to build a house per square foot: 2025, with 2024 for comparison
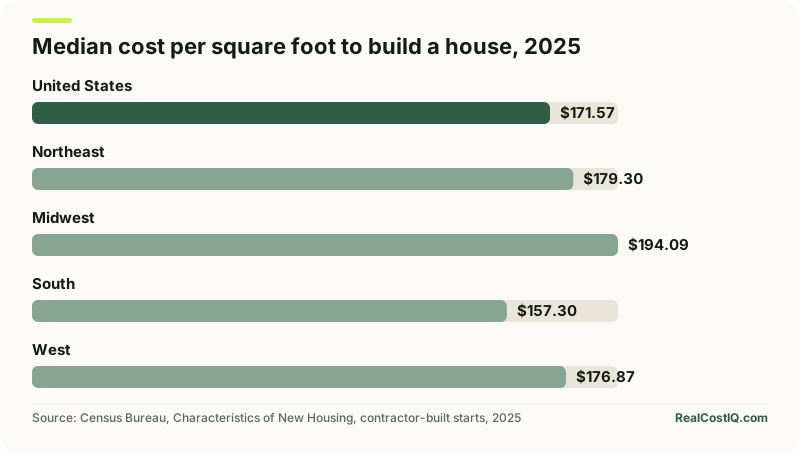
The newest full-year figure is Census's 2025 median contract price for new contractor-built houses: $171.57 per square foot nationally, land excluded. The average was $198.33. The 2024 median was $165.15, so the median rose 3.9% in a year. The average rose 7.5%, from $184.55. Census has not published 2026 figures yet, so no 2026 per-foot number exists in these tables. A contract price is what the general contractor was awarded to build the house. It leaves out the lot and generally leaves out later change orders.
| Area | 2024 median | 2025 median | Change in median | 2025 average |
|---|---|---|---|---|
| United States | $165.15 | $171.57 | +3.9% | $198.33 |
| Northeast | $187.72 | $179.30 | -4.5% | $246.26 |
| Midwest | $183.62 | $194.09 | +5.7% | $202.13 |
| South | $146.04 | $157.30 | +7.7% | $179.96 |
| West | $172.14 | $176.87 | +2.7% | $213.85 |
Source: Census Bureau, Characteristics of New Housing, median and average contract price per square foot of new contractor-built single-family houses started (file last saved by Census June 1, 2026; read 2026-10-19). Percent changes are our division of Census's medians. The Northeast and South medians carry relative standard errors of about 10% and 9% in 2025, so a small regional change is within the margin of error.
Census does not rate houses as budget or luxury. But it counts starts by price band, and that works as a rough tier guide. Of the 131,000 contractor-built houses started in 2025, about 6,000 (4.6%) had a contract price under $70 per square foot. About 14,000 (10.7%) were $70 to $100. About 31,000 (23.7%) were $100 to $150, and 80,000 (61.1%) were $150 or more. In 2024, 58.3% of 127,000 starts were $150 or more. So the typical new house now sits in the top band, and a quote below $100 per square foot is rare.
| Price band per sq ft | 2024 starts | 2024 share | 2025 starts | 2025 share |
|---|---|---|---|---|
| Under $70 | 5,000 | 3.9% | 6,000 | 4.6% |
| $70 to $99.99 | 14,000 | 11.0% | 14,000 | 10.7% |
| $100 to $149.99 | 34,000 | 26.8% | 31,000 | 23.7% |
| $150 and over | 74,000 | 58.3% | 80,000 | 61.1% |
| Total | 127,000 | 100.0% | 131,000 | 100.0% |
Source: Census Bureau, Characteristics of New Housing, houses started by contract price per square foot (read 2026-10-19). Census reports starts in thousands, rounded, so bands are our sums of Census's finer bands, and the shares are our division. Components may not add exactly.
For a dollar total, multiply the median for your region by your plan's finished square feet. A worked table is further down. To see how the money is paid out during the build, use the construction loan calculator. For a smaller project, the ADU cost and ROI calculator gives costs by unit type.
Two datasets, two different per-square-foot numbers
The first is NAHB's Cost of Constructing a Home study, dated January 20, 2025. It covers the fall 2024 survey. NAHB emailed a questionnaire to a sample of 4,000 home builders. After an outlier analysis, it kept usable responses from 41 builders. An outlier is an answer far from the rest. The report says the survey is designed to show percentage cost breakdowns for a typical home built by a subset of NAHB builders. It says the survey is not designed to capture representative characteristics of the average home built in a year. For averages, it defers to the Census Bureau's Survey of Construction. It also says its results are national only, because the sample is too small for a geographic breakdown. Treat it as the best public answer to 'what share of a new house is the structure'. Treat it as a rough answer to 'what does a house cost'.
The second is the Census Bureau's Characteristics of New Housing. Its 2025 annual tables were published July 1, 2026. Its sample is far larger. Its price concept is also narrower. The Census definitions page says the contract price is the price on the original contract awarded to the general contractor. It generally does not reflect later change orders, and it does not include the cost of the land. A change order is a signed change to the original job. A sales price, by contrast, is the price agreed between buyer and seller and includes the improved lot. The per-square-foot table used below is for contractor-built houses started in the year. These are houses built for owner occupancy on the owner's land under a single general contractor.
| NAHB Cost of Constructing a Home (2024) | Census contract price per sq ft (2025) | |
|---|---|---|
| Who answered | 41 usable builder responses from a 4,000-builder mailing, fall 2024 | Census Survey of Construction, contractor-built houses started in 2025 (131,000 starts) |
| Price concept | Sale price of a new house, split into seven parts including the lot | Original contract price to the general contractor, land excluded, change orders generally excluded |
| Floor area | 2,647 sq ft average finished area in the sample | Median and average computed by Census from unrounded figures; median size of contractor-built houses completed in 2025 was 2,433 sq ft |
| Geography | National only | United States and four Census regions |
| Headline per-foot figure | $161.77 construction; $251.34 whole price (our division) | $171.57 median; $198.33 average |
NAHB per-foot figures are our division of NAHB's dollar averages by its 2,647 sq ft average finished area ($428,215 / 2,647 = $161.77; $665,298 / 2,647 = $251.34). NAHB does not publish a per-foot figure. Census publishes the median and average contract price per square foot directly.
The two construction-side numbers, $161.77 and $171.57, are close enough that it is tempting to say they agree. But they come from different years (2024 survey, 2025 starts), different samples and different definitions. So the closeness is a sanity check, not a reconciliation. Both say the same thing at a coarse level. A new house built by a general contractor, land excluded, cost somewhere in the $160s to $170s per finished square foot nationally in 2024 to 2025. Neither says what your house costs.
Where a new-house dollar goes: NAHB's seven-part split
The most useful thing in the NAHB study is not the construction figure. It is the other 35.6%. Builders were asked to divide the average sale price of $665,298 into seven categories. The table gives NAHB's dollar averages and shares. Our per-square-foot column is dollars divided by 2,647 sq ft.
| Component | Average | Share of price | Per sq ft (our division) |
|---|---|---|---|
| Finished lot cost (including financing of the lot) | $91,057 | 13.7% | $34.40 |
| Total construction cost | $428,215 | 64.4% | $161.77 |
| Financing cost | $10,220 | 1.5% | $3.86 |
| Overhead and general expenses | $38,248 | 5.7% | $14.45 |
| Marketing cost | $5,633 | 0.8% | $2.13 |
| Sales commission | $18,955 | 2.8% | $7.16 |
| Profit | $72,971 | 11.0% | $27.57 |
| Total sales price | $665,298 | 100.0% | $251.34 |
Source: NAHB, Cost of Constructing a Home-2024, Table 1. NAHB notes that percentages and averages may not sum to totals because of rounding; the components add to $665,299. Average finished area 2,647 sq ft; average lot 20,907 sq ft.
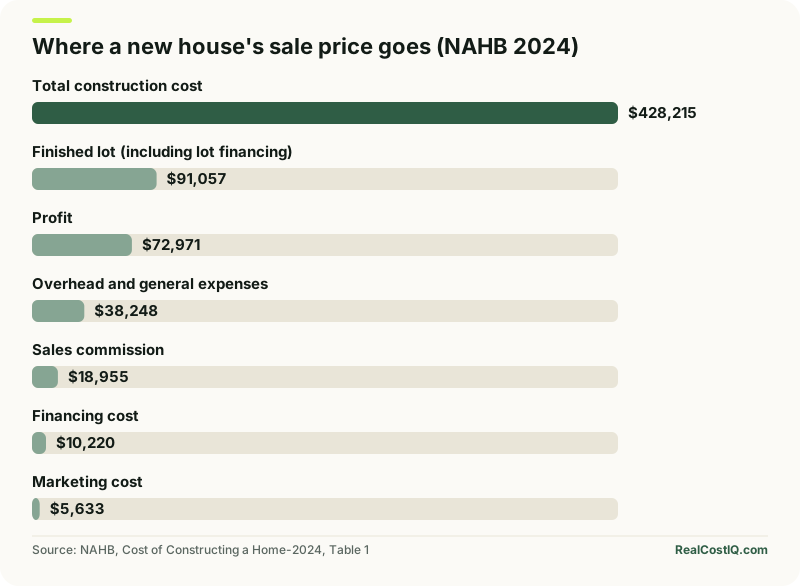
Three points about this table. First, the profit line is a builder's pre-tax margin on a house built for sale. Say you are building on your own land under a contract with a general contractor. Then you do not pay a production builder's lot margin or sales commission. But you still pay for the lot (you own it, so it is already spent). You also pay the contractor's overhead and profit, which sit inside the contract price, and your own financing. Second, NAHB reports that the finished lot share of 13.7% is a series low. It reports that construction cost's 64.4% share is a series high since the survey began in 1998. NAHB cautions that year-to-year comparisons are affected by different builders answering each time. Third, the $251.34 per square foot for the whole house is higher than any single contract-price figure. It contains a lot, a profit margin and a sales cost that a contract price does not.
The NAHB sample's average sale price of $665,298 is also well above Census's own price series. The NAHB report itself says the figure is roughly $150,000 higher than the latest annual Census average ($514,000 for 2023). It blames the gap on the survey not controlling for builder size, among other things. That is a reason to use NAHB's shares more than its dollars.
Inside the construction cost: eight stages
NAHB splits the $428,215 construction cost into eight stages and 36 line items. Each category includes labor paid directly by the general contractor, subcontractor charges and materials, however they were purchased. Here are the eight stages with our per-square-foot division.
| Stage | Average | Share of construction cost | Per sq ft (our division) |
|---|---|---|---|
| Site work (permits, impact and utility fees, design) | $32,719 | 7.6% | $12.36 |
| Foundations | $44,748 | 10.5% | $16.91 |
| Framing (including roof framing, trusses, sheathing) | $70,982 | 16.6% | $26.82 |
| Exterior finishes (siding, roofing, windows and doors) | $57,510 | 13.4% | $21.73 |
| Major systems rough-ins (plumbing, electrical, HVAC) | $82,319 | 19.2% | $31.10 |
| Interior finishes (insulation, drywall, trim, cabinets, flooring, fixtures) | $103,391 | 24.1% | $39.06 |
| Final steps (landscaping, driveway, outdoor structures, clean-up) | $27,710 | 6.5% | $10.47 |
| Other | $8,835 | 2.1% | $3.34 |
| Total construction cost | $428,215 | 100.0% | $161.77 |
Source: NAHB, Cost of Constructing a Home-2024, Table 1, section II. The stage shares quoted here match NAHB's published shares; the NAHB blog post on the same study reproduces this Table 1. The per-square-foot column is each stage's average divided by NAHB's 2,647 sq ft average finished area, not a trade's unit price; stages sum to $428,214 because of rounding.
Interior finishes are the largest stage at 24.1%. They are ahead of the combined plumbing, electrical and HVAC (heating and cooling) rough-ins at 19.2% and framing at 16.6%. A rough-in is the first stage of that work, done before the walls are closed. Within interior finishes, NAHB's detail shows cabinets and countertops at $19,056, flooring at $15,388, drywall at $13,962, interior trim and doors at $12,920 and painting at $11,150. Within rough-ins, plumbing ($27,180), electrical ($27,383) and HVAC ($26,938) are nearly equal. Those are averages for NAHB's sample of homes. A house with a more expensive kitchen or a heat pump system will move them.
Permits, impact fees and utility connections sit inside 'site work'
NAHB's site work stage is $32,719 on average. It is the one most likely to be missing from a per-square-foot quote. Its five lines are building permit fees ($7,640), impact fees ($6,367), water and sewer fees and inspections ($6,260), architecture and engineering ($6,480) and other ($5,972). Impact fees are charges a local government sets to pay for the roads, schools and services a new home uses. The three government-fee lines add to $20,267, or about $7.66 per square foot on the 2,647 sq ft average. These are national averages across 41 builders. NAHB says it cannot break them out by state. So your county can be a fraction of this or a multiple of it. The right way to fill this line in is to ask the building department for the permit and impact fee schedule. Then ask the water or sewer authority for tap fees, and add the result.
NAHB's separate June 2026 study estimates that regulation at all levels accounts for $131,734, or 26.4%, of a $499,500 average new-home price. It is built from a survey of 54 land developers and 337 builders. That is a trade association's estimate of a broader concept. It covers regulation during land development and during construction, including code changes, not only fees. So it is not directly comparable to the fee lines above. It is cited here only to show that fees and approvals are a material part of the all-in price, not to size your permit bill.
The Census benchmark: contract price per square foot, by region
Census publishes the median and average contract price per square foot of new contractor-built single-family houses started. It does this for the nation and four regions, back to 1987. The median is the middle value, with half of houses above it and half below. The series has climbed steeply in the last few years.
| Year | United States | Northeast | Midwest | South | West |
|---|---|---|---|---|---|
| 2019 | $116.16 | $136.80 | $125.10 | $102.93 | $139.36 |
| 2020 | $124.95 | $144.85 | $137.98 | $109.74 | $122.37 |
| 2021 | $131.23 | $179.11 | $150.07 | $114.79 | $141.25 |
| 2022 | $156.93 | $183.19 | $177.61 | $137.74 | $186.63 |
| 2023 | $163.15 | $193.49 | $197.57 | $145.01 | $171.43 |
| 2024 | $165.15 | $187.72 | $183.62 | $146.04 | $172.14 |
| 2025 | $171.57 | $179.30 | $194.09 | $157.30 | $176.87 |
Source: Census Bureau, Characteristics of New Housing, Median and Average Contract Price per Square Foot of New Contractor-Built Single-Family Houses Started (file last saved by Census June 1, 2026). Contract price excludes the value of the improved lot. 2025 relative standard errors for the median row: US 4%, Northeast 10%, Midwest 4%, South 9%, West 4%.
The national median rose 3.9% from 2024 to 2025 ($165.15 to $171.57). It rose 37.3% from 2020 ($124.95). The 2025 average, $198.33, is 15.6% above the median. That is the usual signature of a right-skewed distribution: a minority of expensive houses pull the average up. The Census distribution table shows 80,000 of the 131,000 houses started in 2025 had a contract price of $150 per square foot or more. That is about 61%. About 5%, or 6,000 houses, were under $70 per square foot.
Two cautions on the regional columns. First, the Census file reports a relative standard error with each estimate. This is a measure of how uncertain the number is. The Northeast and South medians in 2025 carry errors of 10% and 9%, against 4% for the nation. So a year-to-year dip such as the Northeast's fall from $187.72 to $179.30 should not be read as a real price fall. Second, the regional averages, not shown in the table, swing more. The Northeast 2025 average of $246.26 has a 20% standard error. For a state like Delaware, the only Census breakdown is the region it sits in, here the South at $157.30. No state figure exists in these tables.
Turning a per-foot number into a budget for one house
Suppose you are planning a 2,400 sq ft house in the South. Census's 2025 median contract price per square foot there is $157.30. That gives $157.30 x 2,400 = $377,520 for the contract with the general contractor, land excluded. This is an illustration of the arithmetic, not a forecast. A median per-foot price multiplied by a chosen size is not the median price of a 2,400 sq ft house. A custom or hillside design will not sit on the median. The Census median size of contractor-built houses completed in 2025 was 2,433 sq ft (average 2,773). That is why 2,400 is a reasonable round figure to test with.
| Region (median $/sq ft) | 1,800 sq ft | 2,400 sq ft | 3,000 sq ft |
|---|---|---|---|
| United States ($171.57) | $308,826 | $411,768 | $514,710 |
| Northeast ($179.30) | $322,740 | $430,320 | $537,900 |
| Midwest ($194.09) | $349,362 | $465,816 | $582,270 |
| South ($157.30) | $283,140 | $377,520 | $471,900 |
| West ($176.87) | $318,366 | $424,488 | $530,610 |
Multiplication of Census 2025 medians by the sizes shown. Contract price excludes land and generally excludes later change orders. Northeast and South medians have relative standard errors of 10% and 9%. This is arithmetic, not a quote.
Now list what is outside that contract. The Census definition says land is outside. NAHB's table gives a sense of the size of the other items for a builder-sold house, as national averages. A finished lot is $91,057 (this one includes the lot's financing). Financing of the build is $10,220, overhead is $38,248, and marketing and commission together are $24,588. The last three are a builder-for-sale cost structure and mostly will not appear in a custom contract. But the lot and your own financing will. Say you buy a lot at the NAHB average for a 2,400 sq ft house. The sum is $377,520 + $91,057 = $468,577. That is before financing, design work you commission outside the contract, landscaping and furniture. Treat that sum as a scale check, since it mixes two datasets with different years and different samples.
What a per-square-foot quote often does not include
- The lot and its development. Census contract price excludes land. NAHB's finished-lot line includes the lot's financing. Your lot may need a well, a septic system or a long driveway. If so, ask the contractor whether those are in the contract. NAHB's driveway line alone averages $9,635 and its landscaping line $9,269.
- Permits, impact fees and utility taps. NAHB's three fee lines total $20,267 on average and sit in 'site work'. Many contracts treat them as owner-paid or as an allowance.
- Design. NAHB counts architecture and engineering at $6,480 on average. If you hire an architect directly, that fee is usually yours. It is not in the contractor's number.
- Allowances. An allowance is a set amount in the contract for an item you have not picked yet. Cabinets and countertops, flooring, lighting and plumbing fixtures are the lines most often handled as allowances. NAHB averages for them are $19,056, $15,388, $5,392 and $7,922. A contract at a low per-foot price with thin allowances will be raised by change orders.
- Outdoor structures and the finish landscape. NAHB's decks, patios and porches average $4,722. Retaining walls are inside its foundation line.
- Interest during construction. Financing is its own NAHB line at $10,220. On a construction loan it depends on draw timing, which the construction loan calculator models.
Quote comparison works only when each bid lists what it includes. Say two bids differ by $30 per square foot. Compare them line by line against the NAHB stages before you conclude that the low bid is cheaper.
General contractor, owner-builder or production builder
The Census categories matter because the three routes differ in what the price covers. A contractor-built house, in Census's wording, is built for owner occupancy on the owner's land. A single general contractor supervises the work. An owner-built house is also on the owner's land, but the owner acts as the general contractor, using paid help, subcontractors or both. A house built for sale is on the builder's land and sold with the land in one transaction. NAHB's seven-part split describes that third route. The Census contract price-per-square-foot series describes the first.
Census publishes size for all three. For houses completed in 2025, the median size was 2,433 sq ft for contractor-built (average 2,773), 2,216 for built-for-sale and 1,922 for owner-built (average 2,301). I did not find an owner-built cost-per-square-foot figure in the tables read for this post. So I cannot say from these sources whether acting as your own general contractor saves money. The honest range of claims is narrower. Owner-builders build smaller houses on average, and Census records them separately. An owner-builder still pays the subcontractors and suppliers that make up NAHB's construction stages, plus whatever the owner's own time costs. The saving, if any, is the general contractor's overhead and profit inside the contract. NAHB's averages for those two lines on a built-for-sale house were 5.7% (overhead) and 11.0% (profit) of the sale price.
Maybe you are weighing a smaller secondary dwelling rather than a full house. Then the ADU cost and ROI calculator prices accessory units by type. ADU stands for accessory dwelling unit. That is a different cost structure from the whole-house figures here.
Financing the number once you have it
Once you have a contract price, a lot price and an allowance for fees, the financing question is one calculation: the total project cost less your down payment or land equity. Construction loans, draws and the conversion to a permanent mortgage are on the construction loan calculator. You can test the permanent payment after conversion on the mortgage calculator. Neither of those tells you what to enter for build cost. This post fills that gap.
How to check a bid against these numbers
- Write down what the bid includes, line by line, and what it says is excluded. Match each excluded item to an NAHB stage so you can add it back.
- Divide the contract price by the finished square footage as Census defines it. That is completely finished floor space, including finished basement and attic space. It excludes garage, carport, porch and unfinished areas. A bid that divides by a larger number, such as total roofed area, looks cheaper per foot than it is.
- Compare the result with your Census region's median ($157.30 to $194.09 in 2025). A bid far below the median deserves a question about allowances and exclusions. A bid far above it may reflect a custom design, a difficult site or a small floor area. Fixed costs spread over fewer feet raise the per-foot figure. That last point is our reasoning, not a Census finding.
- Add the lot, fees, design, financing and a contingency of your choosing. A contingency is extra money set aside for surprises. NAHB's table has no contingency line, so the percentage is a judgment you make with your contractor.
- If the project is larger than your region's median size, check whether the bid prices the extra area at the same rate or at a lower rate for the extra feet.
What these sources cannot tell you
- State or county costs. NAHB says its sample cannot support a geographic breakdown. Census stops at four regions. Any state-level per-foot figure you see elsewhere comes from a different method, usually an unstated one.
- Costs of a custom or high-end house. NAHB's survey asks about the typical house of each responding firm. Census medians describe the typical start. Neither isolates custom builds.
- Current bid prices. Census contract prices are for houses started in 2025, and NAHB's survey was fielded in fall 2024. Material and labor prices have moved since. I did not read any 2026 cost index for this post. So the 2024 and 2025 figures are history, not today's quotes.
- Change orders. Census contract price generally excludes them. They are where a below-median bid usually catches up.
- Paid cost databases. NAHB's own report points readers who need estimates for a particular house to paid services such as RSMeans and Marshall and Swift/CoreLogic. I did not read either today.
Sources and the date each was read are listed below. Every figure in this post comes from one of them, or is computed from them in the text. Where the computation is ours, the text says so.