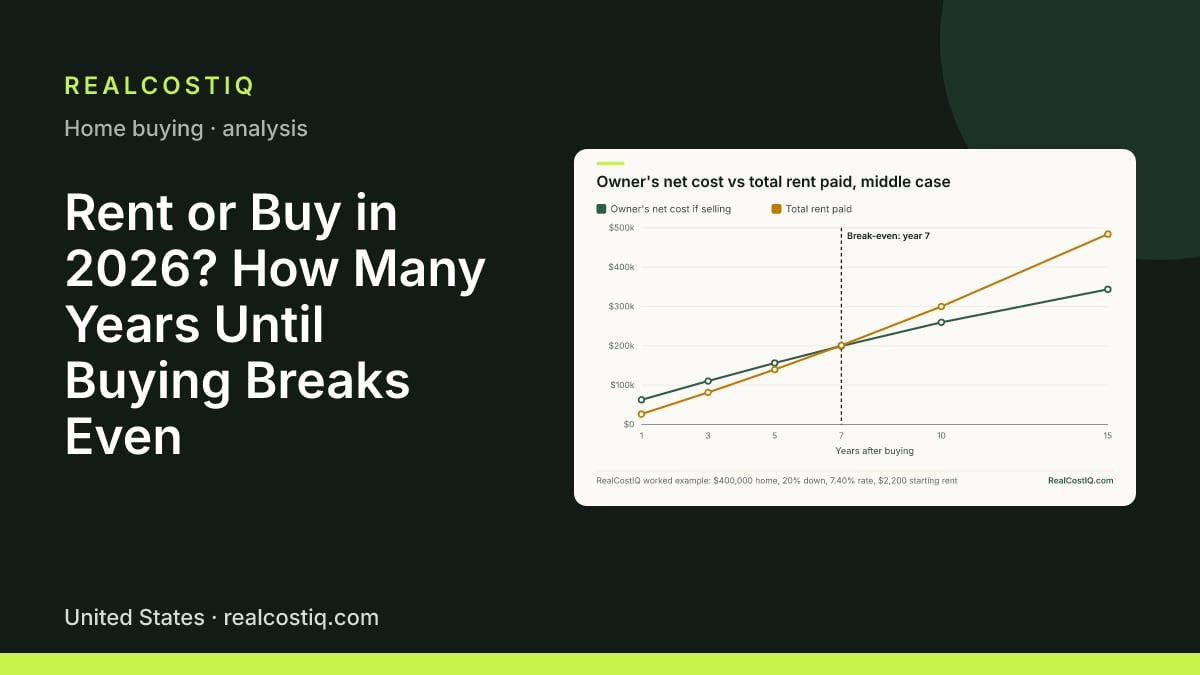
Most rent-or-buy advice gives one answer for everyone, like five years. The honest answer is a range, and the range depends on a few numbers you can check. This article takes one home and one rent, runs the math year by year, and shows when the lines cross. Then it changes one input at a time so you can see which ones matter. It does not tell you to buy or to rent. It shows what each choice costs.
A worked example, with round numbers first
Here is the setup. A home costs $400,000. You put 20 percent down, which is $80,000 in cash. You borrow the other $320,000 for 30 years. Rent for a similar place is $2,200 a month. We will compare the two paths year by year.
Start with year one and round numbers. Renting costs $2,200 times 12, or $26,400. Owning has more parts. The loan payment at 7.40 percent is about $2,216 a month, or $26,587 a year. Property tax at 1.2 percent of the home's price is $4,800. Insurance at 0.5 percent is $2,000. Upkeep at 1 percent is $4,000. Add them up and owning costs about $37,400 in year one. That is roughly $11,000 more than renting. In the first year, about $3,000 of the loan payment is principal, which is the part that pays down your loan. That money is not gone. It shows up later as equity.
Equity is the part of the home you own. It is the home's value minus what you still owe. When you sell, equity comes back to you as cash. But selling costs money too. Buying costs money up front. So the comparison is not payment against rent. It is everything you pay in, minus everything you get back, against rent. The table below shows each input and where it comes from.
| Input | Value | Source or reason |
|---|---|---|
| Home price | $400,000 | Round number for the example |
| Down payment | $80,000 (20%) | Round number; 20% means no private mortgage insurance |
| Mortgage rate | 7.40% | Freddie Mac PMMS, 30-year fixed, survey week of Oct. 8, 2026 |
| Loan payment (principal and interest) | $2,215.62 a month | Standard loan formula on $320,000 for 360 months; same formula as this site's mortgage calculator |
| Starting rent | $2,200 a month | An assumption for a comparable house. The Census median asking rent for all vacant for-rent units was $1,531 in Q2 2026, so check listings near you |
| Rent growth, middle case | 2.8% a year | BLS rent of primary residence, 12 months to September 2026 |
| Home price growth, middle case | 2.6% a year | FHFA House Price Index, 12 months to July 2026 |
| Property tax | 1.2% of price a year | The percentage this site's rent-vs-buy calculator uses; state rates run 0.29% to 1.88% (Tax Foundation, 2024) |
| Insurance | 0.5% of price a year ($2,000) | The percentage this site's rent-vs-buy calculator uses |
| Upkeep and repairs | 1% of price a year ($4,000) | The percentage this site's rent-vs-buy calculator uses; a rule of thumb, not a measured average |
| Cost to buy | 3% of price ($12,000) | Assumption. Buyers generally pay the closing costs, per the CFPB |
| Cost to sell | 6.5% of the sale price | Defaults in this site's cost-to-sell calculator: 5% agent commission plus 1.5% seller closing costs |
Hypothetical home. Growth rates are held flat every year as scenarios, not forecasts. Taxes and insurance are held at their first-year dollar amount, as the calculator does.
What the numbers say: the middle case year by year
Here is the middle case, where rent grows 2.8 percent a year and the home grows 2.6 percent. Each year shows two totals. The first is the owner's net cost if the owner sold that year. It adds the down payment, the cost to buy, and every year of payments, tax, insurance and upkeep. Then it subtracts the cash from selling, after the 6.5 percent selling cost and after paying off the loan. The second is the total rent paid.
| Year | Home value | Loan balance | Owner's net cost | Total rent paid | Owner minus renter |
|---|---|---|---|---|---|
| 1 | $410,400 | $316,992 | $62,655 | $26,400 | +$36,255 (renting is ahead) |
| 3 | $432,018 | $310,267 | $110,492 | $81,438 | +$29,054 (renting is ahead) |
| 5 | $454,775 | $302,474 | $156,196 | $139,602 | +$16,594 (renting is ahead) |
| 7 | $478,731 | $293,441 | $199,539 | $201,068 | -$1,529 (owning is ahead) |
| 10 | $517,051 | $277,129 | $259,560 | $299,874 | -$40,314 (owning is ahead) |
| 15 | $587,855 | $240,478 | $343,644 | $483,876 | -$140,232 (owning is ahead) |
Hypothetical. Computed from the inputs above. Owner's net cost = down payment + cost to buy + loan payments + tax + insurance + upkeep, minus (home value x 93.5% - loan balance).
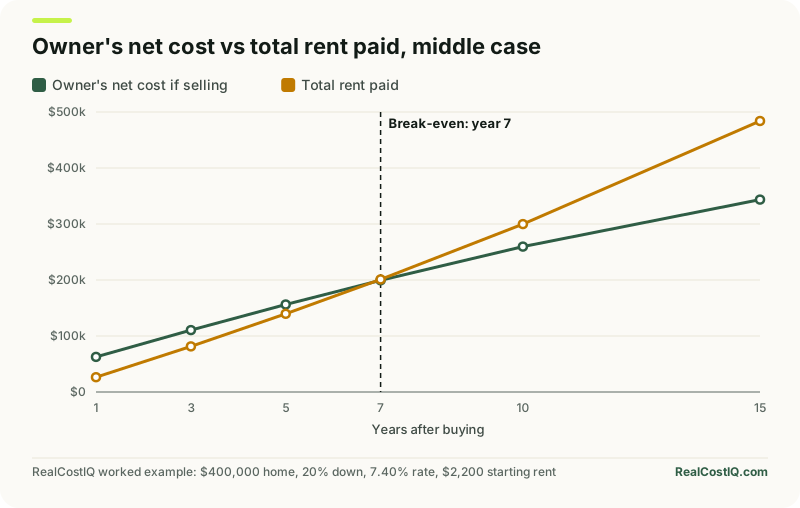
Read the table from top to bottom. In year one the owner is $36,255 behind. Most of that gap is the $12,000 cost to buy and the $26,676 cost to sell, which you pay no matter how the market moves. Each year the gap shrinks. Rent rises, the loan balance falls and the home's value grows. The lines cross in year 7, when the owner moves ahead by $1,529. By year 10 the owner is ahead by $40,314.
The site's own rent vs buy calculator uses the same loan formula and the same tax, insurance and upkeep percentages. Run at 10 years with these inputs, it shows the owner's net cost at $253,960 against $299,874 of rent, an owner advantage of $45,914, with break-even in year 7. That is $5,600 more than the $40,314 in the table. The reason is the cost to buy. The calculator's default is 1.6 percent of the price ($6,400), taken from the site's closing costs calculator. This article assumes 3 percent ($12,000). Both use the same cost to sell, 6.5 percent of the sale price ($33,608 at year 10). Set the cost to buy to 3 percent under the advanced inputs and the calculator returns $40,314.
Three cases: low, middle and high growth
Nobody knows what rents and home prices will do. So instead of guessing, this article shows three cases. The middle case repeats the latest 12-month readings every year. The low case has rent growing 2.0 percent and the home price not growing at all. The high case has rent growing 4.0 percent and the home growing 5.0 percent. Every other input stays the same. These are what-ifs, not predictions.
| Case | Rent growth | Home price growth | Break-even year | Owner minus renter at year 10 | Break-even if the cash earns 4% |
|---|---|---|---|---|---|
| Low | 2.0% | 0.0% | Not within 15 years | +$79,930 (renting is ahead) | Not within 15 years |
| Middle | 2.8% | 2.6% | Year 7 | -$40,314 (owning is ahead) | Year 11 |
| High | 4.0% | 5.0% | Year 3 | -$183,165 (owning is ahead) | Year 4 |
Hypothetical scenarios. The last column adds a 4% yearly return on the $92,000 of cash that went into the purchase ($80,000 down payment plus $12,000 cost to buy), which the renter is assumed to keep. The 4% is an assumption for a safe saving or bond return, not a forecast.
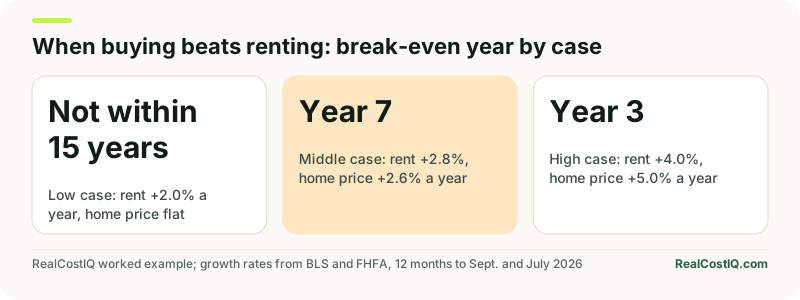
The spread is wide. In the low case, the house never catches up in 15 years. The price stays flat while the owner pays tax, insurance, upkeep, interest and $26,000 to sell. In the high case, the house pays off in year 3. Nobody can say which case is closer to what will happen. The point is that the break-even year is not a fact about homes. It is a fact about a set of assumptions. If someone gives you one number, ask for their growth rates.
What opportunity cost does to the answer
Opportunity cost is what you give up by choosing one path. When you buy, you tie up $92,000 in the house. A renter could keep that money in savings or bonds. If it earned 4 percent a year, it would grow to more than $130,000 in ten years. That is a real cost of owning. Adding it moves the middle-case break-even from year 7 to year 11. The high case moves from year 3 to year 4. This is a quiet reason many people feel buying should break even sooner than it does. Their down payment was never free.
Where the inputs come from
Every rate in the example was read on October 15, 2026, from a primary source. Here is what each says.
- Mortgage rate. Freddie Mac is a government-sponsored company that buys home loans from lenders. Its weekly Primary Mortgage Market Survey, or PMMS, put the 30-year fixed average at 7.40 percent for October 8, 2026. A week earlier it was 7.28 percent, and a year earlier it was 6.30 percent. Your own rate depends on your credit, your down payment and your lender.
- Rent growth. The Bureau of Labor Statistics, or BLS, tracks prices through the Consumer Price Index. Its September 2026 report shows rent of primary residence up 2.8 percent over 12 months. The broader shelter index, which includes owners' equivalent rent, was up 3.2 percent.
- Home price growth. The Federal Housing Finance Agency, or FHFA, publishes a House Price Index. Its report released September 29, 2026 says house prices rose 2.6 percent from July 2025 to July 2026. Across the nine census divisions, the 12-month change ran from 0.6 percent in the Mountain division to 6.3 percent in the Middle Atlantic division.
- Market backdrop. The Census Bureau's Housing Vacancy Survey, released July 28, 2026, shows a national rental vacancy rate of 7.3 percent for the second quarter of 2026, a median asking rent of $1,531 for vacant for-rent units, and a homeownership rate of 65.0 percent. The next release is due October 28, 2026.
- Taxes. The Tax Foundation's 2024 effective property tax rates run from 0.29 percent in Hawaii to 1.88 percent in New Jersey and Illinois. The example's 1.2 percent sits between them.
- Insurance. Insurance.com's 2026 analysis puts the national average homeowners premium at $2,872 a year for $300,000 of dwelling coverage. The example's $2,000 is lower than that average, which favors buying a little. The next section tests it.
Notice that the middle-case rent growth of 2.8 percent and price growth of 2.6 percent are close. That is why the middle case is slow. When rents rise as fast as prices, the owner gets little extra benefit from the market. The owner's edge comes from paying down the loan and from a fixed payment. Meanwhile the renter's cost keeps rising. In the middle case, rent goes from $2,200 to about $2,800 by year 10.
What moves the break-even most
Now change one input at a time, keeping the middle case for everything else. This shows which inputs matter and which do not.
| Input changed | New value | Break-even year | If the cash earns 4% |
|---|---|---|---|
| Middle case | $2,200 rent, 7.40% rate | Year 7 | Year 11 |
| Starting rent | $1,800 | Year 12 | Not within 15 years |
| Starting rent | $2,600 | Year 5 | Year 7 |
| Starting rent | $1,531 (Census median asking rent) | Not within 15 years | Not within 15 years |
| Mortgage rate | 6.50% | Year 6 | Year 8 |
| Mortgage rate | 5.50% | Year 4 | Year 6 |
| Home price growth | 0% a year | Not within 15 years | Not within 15 years |
| Home price growth | 1% a year | Year 14 | Not within 15 years |
| Home price growth | 4% a year | Year 5 | Year 6 |
| Rent growth | 4% a year | Year 7 | Year 9 |
| Property tax | 0.79% (Georgia average) | Year 6 | Year 9 |
| Property tax | 1.88% (New Jersey or Illinois) | Year 9 | Year 14 |
| Insurance | $2,872 (national average) | Year 8 | Year 12 |
| Upkeep | 2% of price a year | Year 10 | Year 15 |
Hypothetical. Each row changes one input from the middle case. The 5.50% and 6.50% rates are what-ifs, not forecasts. Break-even years are capped at 15.
Four inputs stand out. The first is the ratio between price and rent. A $400,000 home costs 15.2 times its yearly rent of $26,400 in this example. That ratio is the price-to-rent ratio. A lower rent against the same price pushes the break-even out fast. At the Census median asking rent of $1,531 a month, the house does not break even in 15 years. The second input is home price growth. Zero growth means no break-even, and each point of growth speeds it up. The third is the mortgage rate. Each point of rate moves the break-even by about a year or two. The fourth is how long you stay. If you expect to move in four years, only the high case wins.
Two inputs matter less than people think. Rent growth changes the break-even only a little, because rent is the renter's whole cost and a few tenths of a point of growth takes years to add up. And state property tax, while large in dollars, moves the break-even by two or three years across the full range.
Notice what the rate rows show. If rates fall to 6.50 percent, the break-even year moves from 7 to 6. That is a real gain, but a lower rate is only one side of the timing question. The post on whether to wait to buy until rates drop covers what a lower rate is worth against the cost of waiting. This article covers the other half: once you own, how long you must stay.
Testing the 5% rule
You may have heard of the 5% rule. It is a rule of thumb from Ben Felix, a Canadian portfolio manager. It is not a law and not a lender standard. It says the yearly cost of owning a home that you cannot get back is about 5 percent of the home's value. That is made of 1 percent for property tax, 1 percent for maintenance and 3 percent for the cost of capital, which covers mortgage interest and what the money could earn elsewhere. Divide by 12 and compare with rent. If rent is higher than the result, buying may make sense. If it is lower, renting may.
Here is the rule on our home. $400,000 times 5 percent is $20,000 a year. That is $1,667 a month. Rent is $2,200, which is higher. The rule says buying may make sense. But the break-even table says that in the middle case you have to stay seven years, and in the low case you never catch up. The rule and the table seem to disagree. Why?
The reason is the 3 percent cost of capital. At a 7.40 percent mortgage rate, the cost of borrowing is much higher than 3 percent. Try the rule with today's inputs. Use 1.2 percent for tax, 0.5 percent for insurance and 1 percent for upkeep. For the cost of capital, take 7.40 percent on the 80 percent of the price you borrow and 4 percent on the 20 percent you put down. That blends to 6.72 percent. The total is 9.42 percent a year, or $3,140 a month. That is above the $2,200 rent, so the rule now says rent.
| Version | Yearly cost as % of price | Monthly cost | Compared with $2,200 rent |
|---|---|---|---|
| Original 5% rule (1% tax, 1% upkeep, 3% capital) | 5.00% | $1,667 | Rent is higher: points to buying |
| Same parts at today's inputs (1.2% tax, 0.5% insurance, 1% upkeep, 6.72% capital) | 9.42% | $3,140 | Rent is lower: points to renting |
| Same, minus 2.6% for the home's price growth | 6.82% | $2,273 | Close to a tie: matches a 7-to-11-year break-even |
Hypothetical. The rule's parts are as reported by WealthGang's summary of Ben Felix's rule. The 6.72% blends 7.40% on 80% of the price and 4% on 20%. The rule as written leaves out price growth; the last row subtracts the middle-case 2.6%.
The last row is the useful one. The rule is built to ignore price growth and uses a low cost of capital. When you put in a high mortgage rate and the actual price growth, it lands within about $70 of the rent. That is a near tie, which is what the break-even table says about the first several years. The rule is a decent first check. It is not a replacement for a year-by-year run. At today's rates, the 3 percent figure in the original is too low for a borrower. Felix himself calls the rule an oversimplification, according to the same summary.
What this does not cover
- Taxes on income. Mortgage interest and property tax can be deductible for people who itemize. That is outside this site's scope and depends on your own tax return. The example ignores it.
- The monthly gap. The owner pays about $900 a month more than the renter in year one. A renter who invests that gap would earn a return on it. The table accounts for the cash put in at the start, but not this monthly gap. If you would not actually invest the gap, ignore this. If you would, treat the break-even as a little too early.
- Where you live. The example is national. A city with high prices and low rents breaks even later. A city with fast rent growth breaks even sooner. State and metro results differ widely.
- Life. Job moves, a growing family and the value of control over your home do not show up in a table.
- Rates move. The 7.40 percent rate is one weekly national average. Freddie Mac updates it every Thursday, so a newer figure may be out. Your own offer may be higher or lower.
- Capital gains. Federal tax rules may exclude part of the gain on a home you lived in, and a large gain may be partly taxed. The cost to sell calculator shows the exclusion check. This example does not tax any gain.
How to run your own break-even
- Pick one home you would really buy and one comparable rental. Use listings, not averages.
- Get a real rate quote, or start with the latest Freddie Mac average. The mortgage calculator gives the loan payment.
- Add your own tax, insurance and upkeep. Use the actual tax bill and an insurance quote.
- Estimate the cost to buy and the cost to sell. The cost to sell is often the largest single hit for a short stay.
- Choose a low, a middle and a high growth case. Do not use one number. Write down your sources.
- Compare the owner's net cost with total rent for years 3, 5, 7 and 10. Find the year the lines cross.
- Ask how likely you are to stay that long. If a move is likely before the break-even, renting is the cheaper path on this math.
The rent vs buy calculator runs the owner-versus-renter comparison for your inputs and shows the totals for the horizon you choose. Its break-even already includes the cost to buy and the cost to sell, and you can change both. None of this is advice to rent or to buy. The right choice depends on your plans, your cash, and how long you expect to stay.