A renewal notice that is hundreds of dollars higher, with no claim filed and nothing changed about the house, feels like a mistake. It usually is not. Premiums have risen in almost every part of the country since 2021, and the reasons fall into six groups. Four of them are about the market, and you cannot negotiate with them. Two of them are about your own policy and file, and you can. This post sorts the six, shows the evidence for each, and works through the one lever most owners have: the deductible. I read every source named here on 2026-10-28.
The six reasons at a glance
Regulators and researchers name the same drivers again and again. The National Association of Insurance Commissioners (NAIC), the group of state insurance regulators, lists extreme weather, construction and repair costs, economic conditions, litigation costs and reinsurance costs. It then lists the factors that apply to you personally: location, claims history, rebuild cost, insurance score, deductible, home age, roof and materials condition, and fire protection. I have grouped those into six, in the order you can check them.
| Reason | Whose cost is it? | Evidence read for this post | Can you change it? |
|---|---|---|---|
| 1. It costs more to rebuild your house | Market-wide | Producer price index for goods going into home building: up 9.7% from Sep 2025 to Sep 2026 | Only by lowering coverage, which is rarely wise |
| 2. More claims where you live | Your area | Claim frequency 5.33 per 100 policies in 2023; average claim $20,062 | No, apart from moving |
| 3. Your insurer's reinsurance costs more | Market-wide | NAIC and the Philadelphia Fed both name it | No |
| 4. Your insurer repriced or pulled back | Your insurer | Non-renewals by insurers up 96% to 216% from 2018 to 2024 | Yes, by switching insurers |
| 5. Something changed on your file | You | NAIC lists claims history, insurance score, roof, home age | Partly |
| 6. Your policy terms shifted | You and your insurer | Percentage deductibles of 1% to 5% scale with the coverage limit | Yes |
The producer price index figure is the BLS index of net inputs to residential construction, goods (series WPUIP2311001), 355.225 in September 2026 against 323.904 in September 2025. It measures material and goods prices, not the cost of rebuilding a particular house.
How big the increase has been
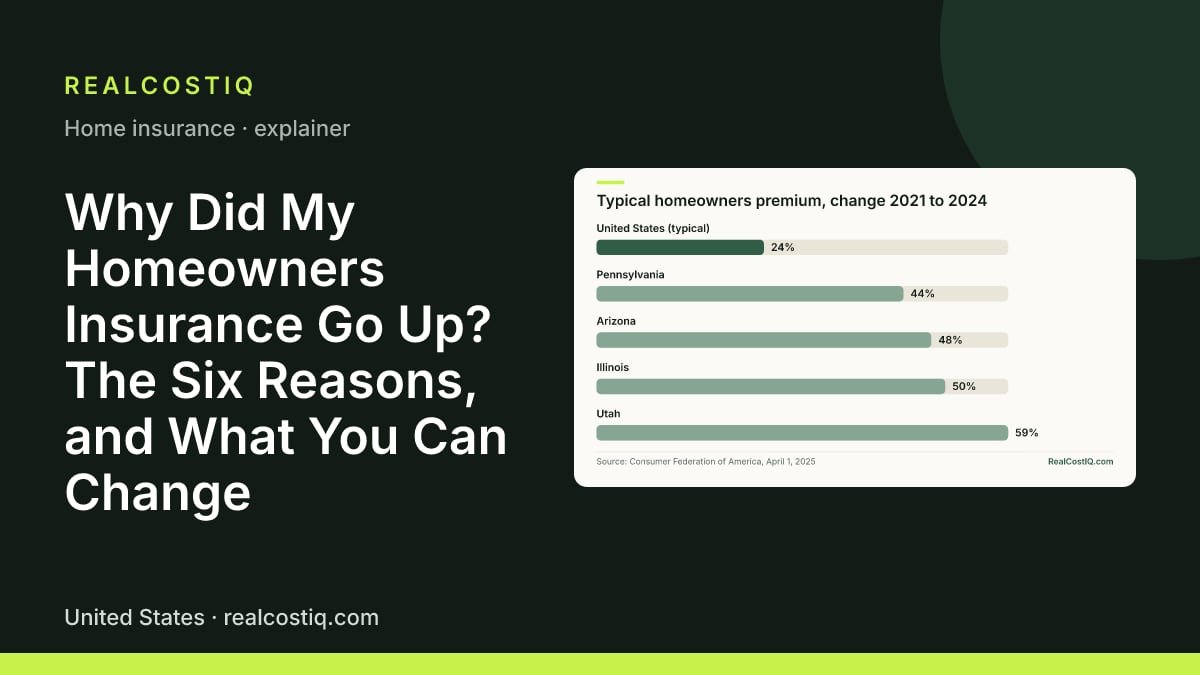
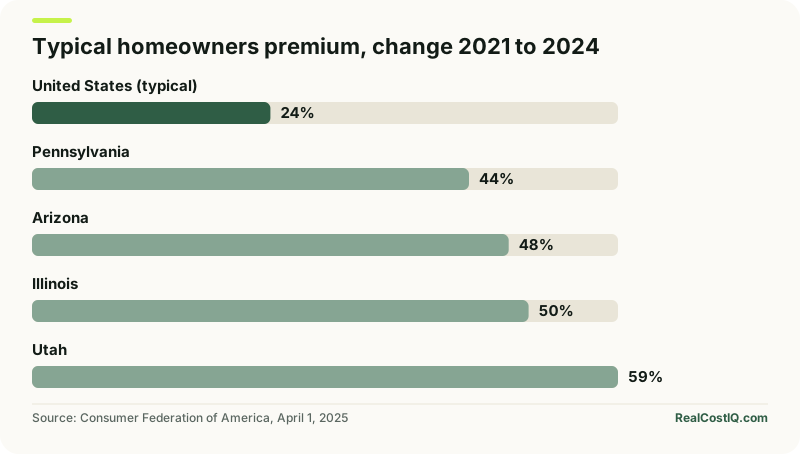
Start with the size of the move, because it tells you whether your jump is ordinary. The Consumer Federation of America (CFA) used industry data it bought. It found a typical premium rose $648 from 2021 to 2024. That is a 24% rise, to $3,303 a year. Premiums rose in 95% of ZIP codes, and in about a third of them the increase was over 30%. By state the largest increases were Utah at 59%, Illinois at 50%, Arizona at 48% and Pennsylvania at 44%.
The NAIC measured the same period a different way. In its report on 2018 to 2024 state data, released on 2026-08-05, inflation-adjusted average premiums per policy rose in every one of its four regions, by 18.3% to 43.3%. The release itself puts that at 2.4% to 5.3% a year, which is what you get if you spread the rise over seven years. If you count the six yearly steps from 2018 to 2024 instead, it is about 2.8% to 6.2% a year. The two ranges measure the same rise; they just divide it differently. The release does not say which region had which figure, and I do not guess. A May 2026 brief from the Federal Reserve Bank of Philadelphia looked at three states. From December 2021 to June 2025, real average premiums rose 28.9% in Pennsylvania, 26.1% in New Jersey and 25.4% in Delaware. It cites earlier research that found a 13% rise in real average premiums from 2020 to 2023.
Reason 1: It costs more to rebuild your house
Your premium is not based on what your house would sell for. The Philadelphia Fed brief is plain on this. A premium is based on the cost to rebuild the house, not its market value. Market value also includes land and the housing market. The dwelling coverage limit on your policy is set mainly from the replacement cost. The brief defines that as the cost to rebuild or repair with similar materials at today's prices. It includes labor, materials, demolition and debris removal. When insurers' models raise the estimated rebuild cost, the limit goes up, and the premium goes up with it. That can happen even if you never asked for more coverage.
A federal price series gives a sense of the direction. The Bureau of Labor Statistics producer price index for net inputs to residential construction, goods, stood at 355.225 in September 2026. A year earlier it was 323.904, so it rose 9.7% over the twelve months. The year before that, from September 2024 to September 2025, it rose 3.4%. This is an index of goods going into home building, not of rebuilding any one house, and labor is not in it. It tells you the materials side did not hold still, and that the last year was a bigger move than the one before.
The NAIC lists the same cause in its consumer explanation: labor and materials cost more, especially in more populated areas and when supply is limited. You can check this one in your own paperwork. Compare the dwelling coverage on last year's declarations page with this year's. If the limit rose by 6% and your premium rose by 10%, the limit explains a large part of the increase. A FEMA page adds a reminder that cuts the other way. Replacement cost coverage costs more than actual cash value coverage, but it pays more when you claim.
Reason 2: More claims where you live
Insurers price by area, and an area with more or larger claims gets higher rates for everyone in it, including owners who have never filed. The NAIC report found claim frequency and severity generally increased across 2018 to 2024, especially from 2021 to 2024. The III reports a claim frequency of 5.33 per 100 policies in 2023, which is about one policy in 19, down from 6.37 in 2020. Even so, the average amount paid per claim was $20,062 in 2023, up from $19,740 in 2022 and above the 2019 to 2023 weighted average of $17,059.
The type of claim matters, because it explains why two ZIP codes can differ so much. The III breaks down the 2023 claims this way.
| Cause | Share of 2023 claims | Average paid per claim, 2019 to 2023 |
|---|---|---|
| Wind and hail | 42.5% | $14,747 |
| Water damage and freezing | 22.6% | $15,400 |
| Fire and lightning | 21.6% | $88,170 |
| All other property damage | 10.0% | $9,043 |
| Liability, theft and other | 3.3% | Not reported |
Source: Insurance Information Institute, from the page read on 2026-10-28. The listed shares add to 100%. Fire is the rarest of the three big causes but the most expensive per claim.
Wind and hail make up more than four of every ten claims. That is why hail-prone states carry heavy wind and hail deductibles, and why a few bad storm seasons in a county can lift rates across it. If your area had a string of storms, a wildfire, or a spike in water damage claims, your rate moves with the area even though your roof did not. You cannot change this reason, but you can find out whether it applies by asking your agent whether the insurer filed an area rate change.
Reason 3: Your insurer's own insurance costs more
Insurers buy insurance themselves. It is called reinsurance, and it spreads big losses, such as a hurricane season, across the global market. The NAIC states that reinsurance costs have risen significantly. The Philadelphia Fed brief explains the chain. Reinsurers have asked for higher prices because their own risk went up. It cites research finding that global reinsurance prices pass through to home insurance premiums. The CFA's release calls reinsurance costly and sold on an unregulated global market.
This cost is paid by every policyholder of the company, whether or not their own house is in a risky area. Nothing on your declarations page will show it, and the insurer does not itemize it. If your agent says the increase is company-wide, this is probably a big part of the reason.
Reason 4: Your insurer repriced the book or pulled back
A company that has lost money in a state raises rates, tightens who it will cover, or leaves. The NAIC report counted 715 companies writing homeowners coverage in 2024, so the market is not short of sellers. It called the market operationally strong overall, even as insurers pull back in specific places. Behind that headline, company-initiated non-renewals rose between 96% and 216% depending on region from 2018 to 2024. The NAIC page also says insurance markets are local, so a national average can hide a local squeeze.
For you this reason has a practical test. If your insurer's increase is far above what neighbors report from other insurers, the company repriced for its own reasons. That is the one market-wide cause you can act on, because you can move to a company that wants your kind of house. See the section on shopping below. If your notice is a non-renewal, not a price rise, the cause is the same. Your lender will still require coverage. Read how a lender tests a replacement policy in our lender insurance requirements post.
Reason 5: Something changed on your own file
The NAIC's list of home factors that shape a premium is specific. It names location, claims history, rebuild cost, insurance score, deductible, home age, the condition of the roof and materials, and fire protection, meaning the distance to a hydrant and the quality of the local fire department. Several of these change with time without any action on your part. The roof is a year older. A discount for a new roof may have expired. A claim from a few years ago may still be in the report the insurer pulls. Your credit-based insurance score may have moved.
A credit-based insurance score is not your loan score. The NAIC says it estimates the likelihood of an insurance claim, and insurers use it in underwriting and in setting the premium. In most states an insurer cannot use these scores as the sole reason to raise a rate, or to deny, cancel or not renew a policy. Many states require a notice when credit information played a part in an adverse decision. You generally have the right to see that notice and dispute inaccuracies in the credit report behind it. I did not read a current state-by-state list of bans today, so check your state insurance department for the rule that applies to you.
A claim is the other item that sits on your file. Whether to file a small claim at all is its own decision, and the numbers are in our post on small claims and the CLUE report. The point for this post is narrow: if you filed a claim in the last few years, ask whether it is the reason for the increase. If you did not, rule it out.
Reason 6: Your policy terms shifted
This reason is the least discussed and the cheapest to check. Open last year's and this year's declarations pages side by side. Compare five lines. They are the dwelling limit, the deductible, whether the deductible is a dollar amount or a percentage, whether the roof is covered at replacement cost or actual cash value, and the endorsements listed. The NAIC suggests asking whether the deductible is a fixed amount or a percentage of insured value, and whether the policy pays actual cash value or replacement cost value.
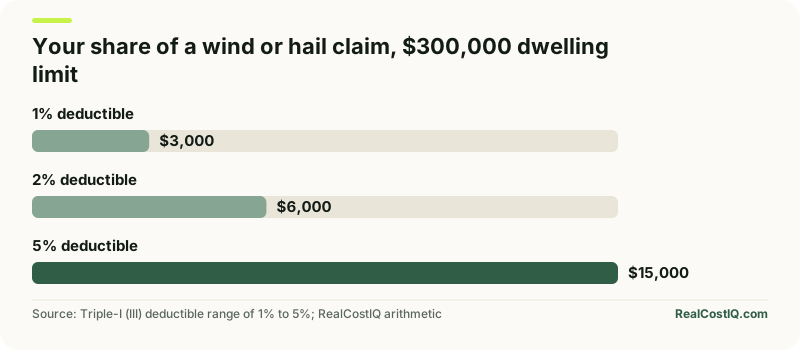
The percentage deductible is the quiet one. The III says wind and hail deductibles are most often a percentage, typically 1% to 5%. The percentage applies to the insured value of the home. So when the dwelling limit rises, a percentage deductible rises with it, even if the percentage on the page is the same. Here is the arithmetic on an illustrative home.
| Deductible | You pay first | If the limit rises 9.7% to $329,100 | Increase |
|---|---|---|---|
| 1% | $3,000 | $3,291 | $291 |
| 2% | $6,000 | $6,582 | $582 |
| 5% | $15,000 | $16,455 | $1,455 |
Illustrative. The 9.7% is the materials price move from the federal index above, used here only to show the effect of a rising limit. Your insurer's limit change will differ. The III's own example is a $100,000 home with a 2% deductible, where the first $2,000 of a claim is yours.
Some insurers also switch a policy from a flat deductible to a percentage one at renewal, or add a separate roof deductible. The renewal premium may look lower, or only a bit higher, because you took on more risk. You may not notice until a storm. A renewal that rose less than you feared can still be a worse deal. That is the other half of this reason: the price can go up, or the protection can go down, and both look like a cost increase.
What you can change, and roughly how much it is worth
Four of the six causes are out of your hands, and I would not spend effort arguing with them. The levers you do have come straight from the NAIC and III guidance, and I give the dollar figures only where a source states them.
| Lever | What the source says | Worth |
|---|---|---|
| Shop several insurers | Compare policies with similar coverage (NAIC); the III suggests three quotes and a check of each company's financial strength | Often the largest one, since Reason 4 differs by company |
| Raise the deductible | The III says raising it to $1,000 may save as much as 25% | Up to 25% of the premium, an upper bound |
| Bundle home and auto | Some insurers take 5% to 15% off for two or more policies (III) | 5% to 15% at some companies |
| Stay with one insurer | Some take 5% off after three to five years and 10% off after six or more (III); but compare periodically | 5% to 10% at some companies |
| Security and fire devices | Smoke detectors, burglar alarms or dead bolts may earn at least 5% off; a sprinkler system with a monitored alarm may earn 15% or 20% (III) | 5% to 20% |
| Disaster-resistant upgrades | Storm shutters, reinforced roof (III); ask your state insurance department about mitigation grants (NAIC) | Varies |
| Review the credit-based score | Insurers use credit information in pricing (III, NAIC) | Varies |
| Remove land value from coverage | Land is not at risk from covered perils, so it should not factor into the limit (III) | Avoids paying for coverage you cannot claim |
The III page I read has no publication date, and its $1,000 deductible example is a round figure that may not match today's premiums. Treat every percentage as what some insurers offer, not a promise. Discounts differ by company and state.
Do not use the discounts as a reason to under-insure. Cutting the dwelling limit lowers the premium and also lowers what the insurer pays when the house is damaged. If the limit falls below what it costs to rebuild, you carry the gap. The lender requirements post covers where the 80% rule and the mortgage clause apply.
The deductible math: is a higher deductible worth it?
The deductible is the one lever where you can price the trade yourself. Say your renewal premium is $3,000, close to the CFA's $3,303 typical figure, and you move from a $500 deductible to $1,000. The III says the move may save as much as 25%. That is an upper bound, so the saving is at most $750 a year. The cost is $500 more out of pocket on any claim larger than $1,000.
To price the risk, use the III's claim frequency of 5.33 per 100 policies in 2023. That is a 5.33% chance in a given year that a policy produces a claim. If every claim exceeds $1,000, the expected extra cost of the higher deductible is $500 times 0.0533, about $26.65 a year. Set that against a saving of up to $750 a year. The higher deductible comes out ahead on average, even if the real saving is a small part of the maximum. The break-even saving is under 1% of the premium. Two warnings apply. The frequency is an industry average and your risk may be higher. And the math assumes you have the extra $500 in cash when the claim comes, which is the NAIC's condition for raising a deductible at all.
The same arithmetic does not carry over to a percentage deductible. Raising a wind and hail deductible from 1% to 5% on the $300,000 home above puts $12,000 more of a storm loss on you. With wind and hail at 42.5% of claims, that is the claim type most likely to trigger it. Treat a percentage deductible like a loan you may have to repay in a bad year, and keep the cash for it.
What the increase does to your mortgage payment
If your lender collects insurance through escrow, the jump reaches you twice. Take the CFA's national figures: a typical premium of about $2,655 in 2021 (the $3,303 minus the $648 rise) and $3,303 in 2024. In monthly terms that is about $221 and $275, so the escrow line rose $54 a month. If the lender's analysis then finds the account short, it asks for a catch-up amount on top, which is spread over the following year. The steps for that are in our escrow shortage post. If you have no escrow, the bill arrives as one larger annual payment instead.
Your lender also has a say. A policy that lapses or fails its tests is a problem for the loan. Deal with a non-renewal notice at once. Send your lender the new declarations page when you switch companies. The tests are laid out in the lender requirements post linked above.
What to do with a renewal notice, in order
- Put last year's and this year's declarations pages side by side. Note the dwelling limit, the deductible and its form, the roof terms, and the endorsements. This takes ten minutes and tests Reasons 1 and 6.
- Ask your agent or insurer which of three things changed: the base rate for your area, your rating factors, or your coverage. Ask whether the company filed a rate change in your state.
- Check Reason 5. Is the roof older, has a discount lapsed, did a claim or credit-based insurance score change? You can usually ask for the reasons behind an adverse credit-based decision.
- Get at least three quotes with the same dwelling limit, the same deductible form and the same replacement-cost terms. Comparing on price alone is how people end up with a percentage deductible they did not mean to accept.
- Price the deductible with the math above before you raise it. Keep the cash on hand to cover it.
- Ask for every discount in the table, then ask your state insurance department about mitigation grants for a roof or other upgrades.
- If you switch, give the new declarations page to your lender before the old policy ends, so there is no gap.
What the data cannot tell you
A few caveats keep this post honest. The NAIC release does not blame the premium and non-renewal increases on any one cause, and neither do I. The six groups are the drivers the sources name, not a ranking by size. No source I read tells you what share of your increase each reason explains, and an insurer rarely itemizes it. The BLS publishes a price index line for tenants' and household insurance. It prices renters' contents policies and explicitly excludes the structure and liability coverage in homeowners policies, so it cannot be used as a homeowners price gauge and I left it out. The III's premium series on the page I read ends in 2022, and the CFA data runs to 2024. The Philadelphia Fed numbers are for three states. Finally, the 2026 premium for your own house depends on factors no national source can see.
What the sources do support is a fair sorting rule. If the notice is a 5% to 10% rise with a similar dwelling limit, expect a market-wide cause and shop. If it is far larger, look first at your policy terms, then at your file, and then at your insurer. For the cost of the premium itself against what a similar home pays, our home insurance costs topic page lays out the typical range.